October 6, 2020: Copper, Corn Show Potential To Follow Commodities’ Rabbit Gold - Bloomberg

This analysis is by Bloomberg Intelligence analyst Mike McGlone. It appeared first on the Bloomberg Terminal.
The metals sector has the biggest relative-value edge in commodities, in our view, especially with rising debt-to-GDP, zero rates and quantitative easing so entrenched, and as declines in most currencies vs. gold spill over to other hard assets. Enduring energy-price deflation pressures broad commodities, but limited upside in U.S. stocks vs. GDP signals similar for the dollar — a commodity tailwind. Copper’s stalwart 3Q despite equity reversion shapes our view of a nascent metals bull market, bolstered by technology and decarbonization that limit energy prices but boost demand. A peak greenback is a prerequisite for higher grain prices.
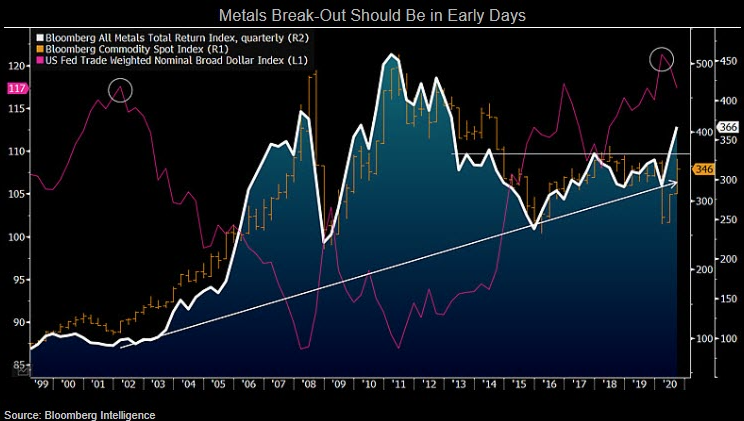
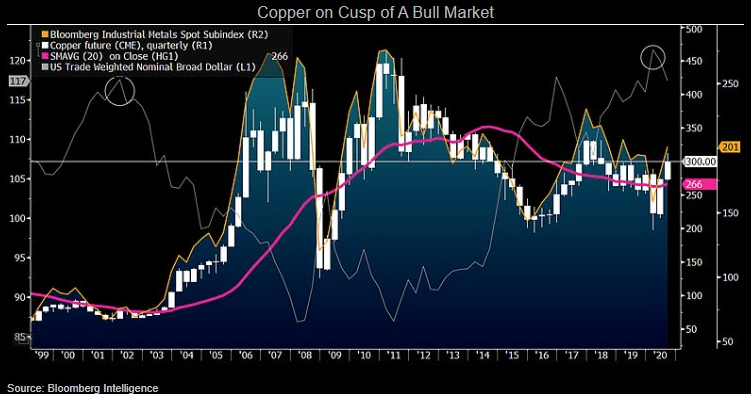
Metals gaining relative value vs. dollar, equities
The highest quarter-end level for copper in two years signals a bear-to-bull market transition in the most significant commodity in the Bloomberg Industrial Metals Subindex, in our view. A peak dollar is needed for industrial metals to advance further, if history is a guide. Our graphic depicts copper and industrial metals in a potentially precarious position to start 4Q, notably if the greenback resumes its upward trajectory since 2011. Yet it’s looking increasingly difficult for the dollar to eclipse its record high in March.
Greenback mean-reversion potential is gaining as a top driver for most of the past decade, with U.S. stock valuations reaching record levels vs. GDP in 3Q. Relative value favors the metals
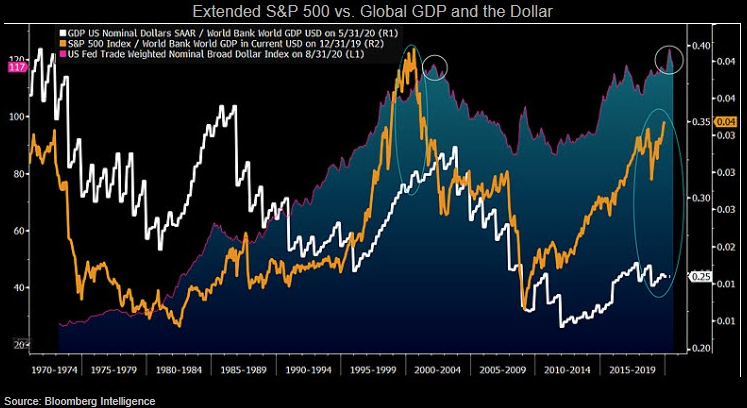
Gold push from dollar similar to 2000
The gold bull market that started with the new millennium and a peak greenback is set for resumption, if history is a guide. Our graphic depicts a primary dollar driver — the performance of the S&P 500 vs. global GDP — nearing an overextended level similar to 2000. The apex in the trade-weighted broad dollar came shortly afterward. A big difference back than was the S&P 500 was advancing vs. global GDP and the U.S. portion was on the rise. Peaking just above 30% in 2003, U.S. GDP dropped to about 25% of the world’s rate at the start of 2020, leaving a wide gap in the ratio of the S&P 500 vs. global GDP.
Gold is often considered the inverse of the dollar, which is measured vs. other currencies. Up about 80% since the start of 2016 vs. an unchanged greenback is a sign of divergent gold strength.
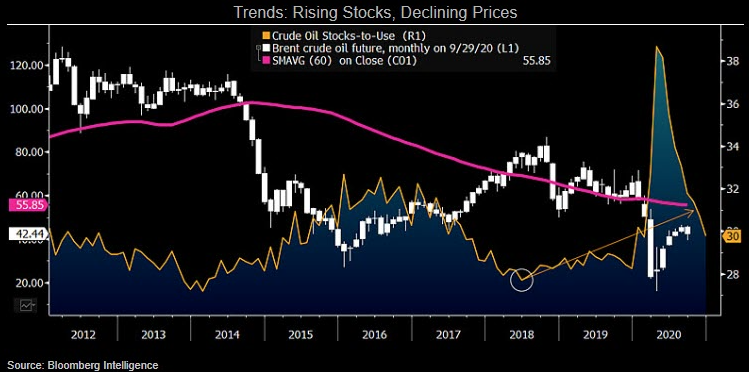
Crude stocks-to-use optimism subject to realism
Hopeful expectations of a demand recovery for oversupplied crude oil are likely to disappoint and keep prices under pressure. Estimate revisions are often a primary driver of prices, and a key issue for crude is that the trend was unfavorable before the pandemic. Our graphic depicts the sharp decline expected in OECD crude and liquid fuels stocks-to-use, using data from the Department of Energy. The mantra, “Good luck with that one,” seems worthy as winter approaches in the northern hemisphere with pandemic agita on the rise. Demand estimates are more likely to be revised lower.
Global crude-oil stocks bottomed in June 2018 and Brent peaked in October that year. We see little to stop the upward trajectory in stocks-to-use juxtaposed with the downward trend in crude oil prices.
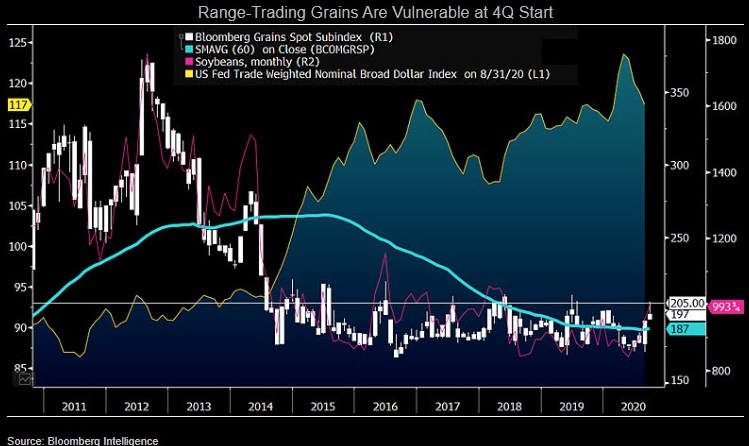
Soybeans, grains near upper end of range
Grains make up the bulk of the agriculture sector and are in a precarious position, approaching a good resistance level within an enduring bear market. Absent an unlikely sustained period of poor weather, supply should remain strong and agriculture prices have limited further upside until the dollar enters a bear market. Our graphic depicts the Bloomberg Grains Spot Subindex near the upper end of its five-year range, with soybeans back in a good resistance zone in the $10-a-bushel handle.
October is typically the best month for the grains index, increasing 3.3% on average in the past 10 years, but following a normally weak September. Early harvest this year and an atypically strong September may shift downside risks into October.